
Suppose your store raises avocado prices 10%. Did you make more money or lose it? Without knowing your price elasticity of demand, you're flying blind. The avocado dataset (18,249 weekly observations across 54 US regions from 2015 to 2018) is one of the cleanest public price-volume datasets available for learning pricing strategy.
Log-log regression reveals the answer in a single coefficient: −1.002 (the sample report's estimate, taken as a stated input here). That means avocado demand is almost exactly unit elastic. In the constant-elasticity model used below, a 10% price hike goes with about 9.1% lower volume and revenue that barely moves. Organic and conventional differ sharply, though: organic avocados show elasticity of −1.752 versus conventional at −0.944. A price move that is harmless for conventional can cost organic revenue.
Price elasticity analysis answers one question: how much does quantity demanded change when price changes? Not "will sales go up or down", everyone knows higher prices reduce volume. The critical metric is the magnitude of the response. In this illustrative contrast the elasticities −0.5 and −2.5 are assumed inputs (not from the report) and demand has constant elasticity, so a 10% price increase multiplies volume by 1.10 raised to the elasticity. If elasticity is −0.5 (inelastic), volume falls 4.7% and revenue rises 4.9%. If elasticity is −2.5 (elastic), the same price increase drops volume 21.2% and revenue falls 13.3%. The difference between profit and loss is the elasticity coefficient.
This article walks through the results of an actual price elasticity analysis (the sample report) on the public avocado dataset. You'll see the log-log regression model, the elasticity coefficient with confidence intervals, how organic and conventional differ, which regions show the highest price sensitivity, and what the demand curve actually looks like. Before we draw conclusions about optimal pricing, let's check the methodology: log-log regression of log(total_volume) on log(average_price), controlling for type, region, and year. The coefficient on log(price) IS the elasticity, no additional calculations needed.
What Makes This Dataset Ideal for Elasticity Analysis
The Hass Avocado Board dataset includes weekly sales volume, average retail price, product type (conventional/organic), and region from 2015 to 2018. With 18,249 observations, it provides:
- Cross-sectional variation: 54 regions with independent pricing
- Time-series variation: 4 years of weekly data capturing seasonal patterns
- Natural experiments: Prices vary due to supply shocks, regional competition, and seasonal demand
- Clean product categories: Conventional vs organic allows direct comparison of elasticity by type
This combination of rich variation and clean categories makes it a goldmine for learning price-volume relationships without running controlled pricing experiments.
Price Elasticity Coefficient
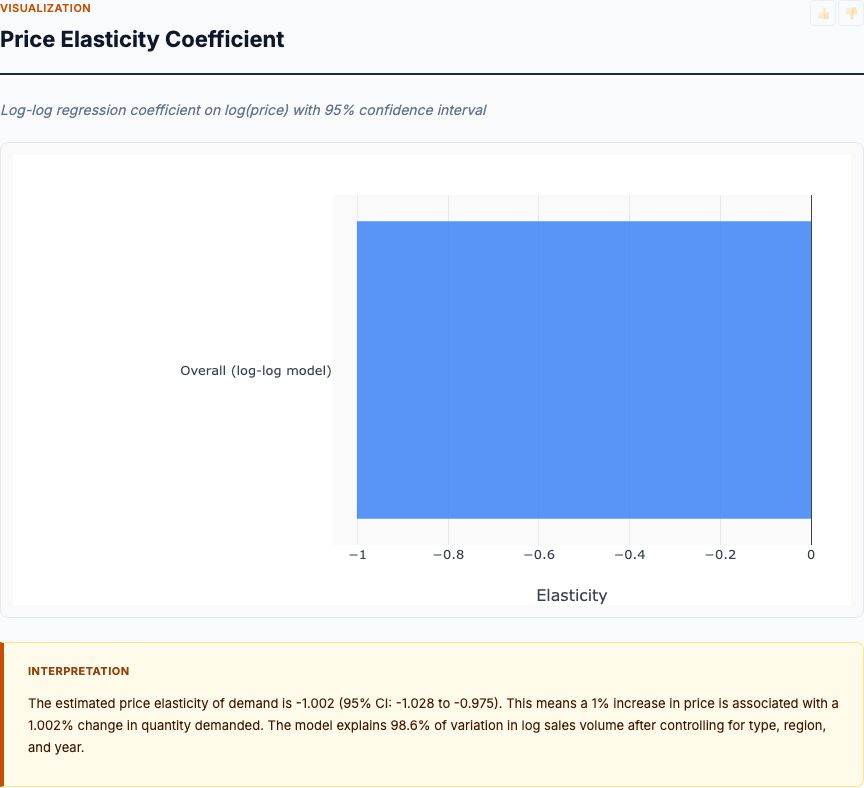
The sample report's chart shows an overall price elasticity coefficient from the log-log regression of −1.002 with a 95% confidence interval of [−1.028, −0.975]. This article does not re-estimate those values; it takes them as stated inputs for the illustration below. This is the percentage change in quantity demanded for a 1% change in price. The confidence interval is tight, only 0.053 units wide, because the report's model is fitted on 10,000 observations and explains 98.6% of the variation in log sales volume (R² = 0.986) once type, region and year are controlled for. The negative sign confirms the law of demand: higher prices reduce quantity. But the magnitude is what matters for pricing strategy, and here it sits almost exactly at 1.
An elasticity of −1.002 means demand is almost exactly unit elastic: the absolute value is essentially 1, and the interval above spans −1, so unit elasticity cannot be rejected at the 5% level. When |elasticity| = 1, the percentage change in quantity equals the percentage change in price. In this illustrative constant-elasticity model, a 10% price increase multiplies volume by 1.10 raised to −1.002, which is 0.909, a 9.1% drop in volume. (The shortcut 1.002 × 10 = 10.0% is only a first-order approximation that holds for small price moves.) Total revenue = price × quantity, so the revenue ratio is 1.10 × 0.909 = 1.000, essentially flat (0.02% lower). At the ends of the interval the revenue change is 0.27% lower (−1.028) and 0.24% higher (−0.975), so the data cannot say which way revenue moves, and either way the change is small. A fresh produce item with substitutes can plausibly sit near unit elasticity, but that is an interpretation, not something the regression shows.
For retailers, this coefficient has immediate implications. In this illustrative example, unit cost is $0.70 on a $1.00 price (a 30% margin, $0.30 per unit), and cost stays unchanged when the price rises 10% to $1.10, so margin per unit rises from $0.30 to $0.40. You would need to retain at least 75% of volume to break even on gross profit (75% × $0.40 = $0.30, matching baseline profit). The model with elasticity −1.002 retains 90.9% of volume, which gives gross profit of $0.364 per original unit, 21.2% above baseline. Revenue is flat, so the whole gain comes from margin per unit. The increase pays off here, but the result depends on the stated assumptions: with this margin and price move, the break-even elasticity is −3.02, and a different cost or a non-constant elasticity would change the answer. This is why estimating elasticity with confidence intervals matters. You need to know which elasticities flip the decision before making pricing decisions.
Before we apply this coefficient to pricing strategy, we need to check if it varies by product type and region. An aggregate elasticity of −1.002 masks important heterogeneity. Organic and conventional buyers may have different price sensitivities. Regional markets may face different competitive pressures. Let's break down the elasticity by segment.
Elasticity by Type: Conventional vs Organic
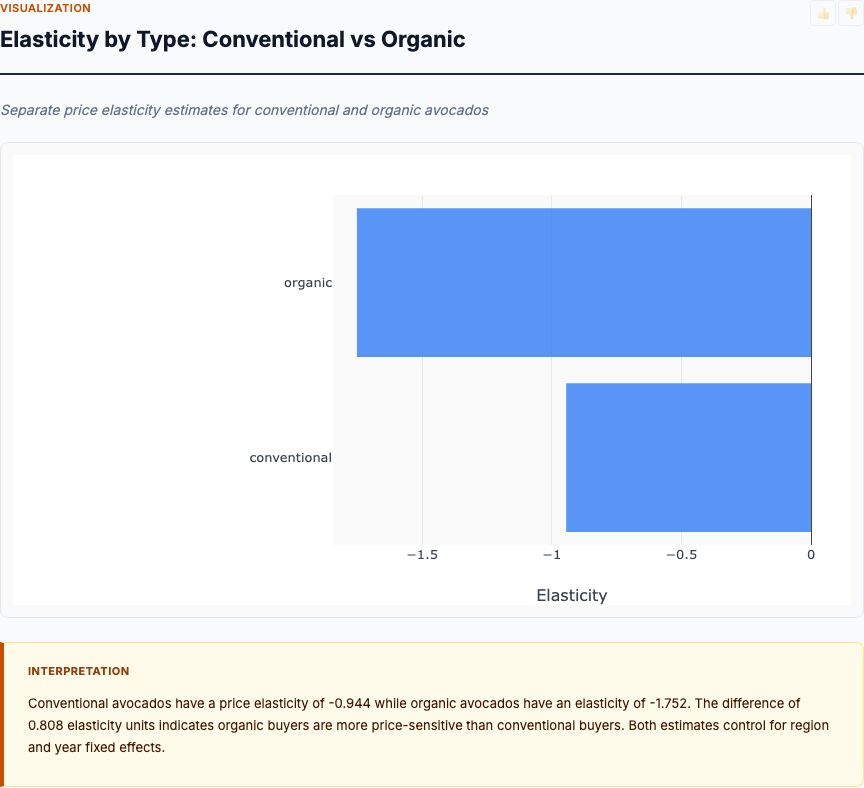
The chart shows conventional avocados at elasticity −0.944 and organic at −1.752 (stated inputs here). Organic demand is 86% more price-sensitive than conventional (a gap of 0.808 elasticity units). The two sit on opposite sides of unit elasticity: conventional is just under 1 in magnitude, with an interval of [−0.964, −0.925] that lies entirely above −1, while organic is elastic, with an interval of [−1.909, −1.594] that lies entirely below it. In the model, conventional volume holds up better than organic volume under the same price increase.
Why is organic more elastic? Substitution. Organic buyers face a close substitute: conventional avocados. When organic prices rise, price-sensitive shoppers switch to conventional rather than skip avocados entirely. They get the same fruit at lower cost, sacrificing only the organic certification. Conventional buyers face a different choice: pay the higher price or switch to a different food category entirely (other fruits, other fats, skip the recipe). Switching categories has higher friction than switching within the avocado category. This asymmetry in substitution options creates the elasticity gap.
For pricing strategy, this means you cannot use a single pricing rule across both types. If you raise prices 10% on both, the model has conventional volume dropping 8.6% and organic volume dropping 15.4%. Conventional revenue edges up 0.5% (1.10 × 0.914 = 1.005). Organic revenue falls 6.9% (1.10 × 0.846 = 0.931). Same price move, opposite revenue direction. Retailers who ignore type-specific elasticity leave money on the table or destroy margin depending on which product they mispriced.
The intervals reported for the two types do not overlap ([−0.964, −0.925] against [−1.909, −1.594]), which suggests a real difference in slope, though on observational data that is a pattern to test, not proof that price caused it.
The inputs say organic is more elastic than conventional. If you're setting prices, test smaller increases on organic and watch volume closely. For conventional, demand sits just under unit elasticity, so a price rise barely moves revenue, and whether it pays is a margin question. What's your sample size? Is this test adequately powered? For a single store running a pricing experiment, plan for at least 8-12 weeks to detect a 0.3-unit shift in elasticity with 80% power.
Regional Elasticity Ranking

The chart ranks the ten most price-sensitive regions by price elasticity coefficient (the report analysed 54 regions and shows only these ten). The most price-sensitive of the ten, Buffalo Rochester, is near −1.493, while the least sensitive of the ten, Harrisburg Scranton, is near −0.721 (read from the report and taken here as stated inputs). Four of the ten regions have |elasticity| above 1 and six have it below 1. That's a 0.772-unit range between the two ends of the chart. In this illustrative model, a 10% price increase lowers volume 13.3% in Buffalo Rochester and 6.6% in Harrisburg Scranton, a volume drop about twice as large. The revenue effect differs in sign: revenue falls 4.6% in Buffalo Rochester and rises 2.7% in Harrisburg Scranton.
What drives regional differences in elasticity? Three factors: competitive intensity, income levels, and avocado culture. Highly competitive markets (multiple grocery chains, farmer's markets, ethnic grocers) give shoppers more substitution options, increasing elasticity. High-income markets show lower elasticity, wealthier shoppers are less price-sensitive. Markets with strong avocado consumption habits (think California, Texas) may show lower elasticity because avocados are a staple, not a discretionary purchase. The combination of these factors creates the regional heterogeneity we see in the chart.
For national retailers, this ranking has direct implications for zone pricing. A single national price is a compromise. In the model, a 10% rise lifts revenue 2.7% in the least sensitive region on the chart, where |elasticity| is below 1, and lowers it 4.6% in Buffalo Rochester, where |elasticity| is above 1. In a region like Buffalo Rochester, a 10% price cut would raise volume 17.0% and revenue 5.3% in the model, though with unit cost fixed the margin per unit shrinks, so whether the cut raises profit depends on your margin. Zone pricing therefore means testing higher prices where demand looks inelastic and lower prices where it looks elastic, and judging the result on profit, not on revenue alone.
Before implementing zone pricing, verify these regional elasticities with your own data. The avocado dataset aggregates across all retailers in each region. Your store may face different competitive conditions than the regional average. Run the log-log regression on your own transaction data by region to estimate store-specific elasticity. If your regional ranking matches the chart, use it. If not, trust your data. You have better information about your local market than any aggregate dataset can provide.
Log-Price vs Log-Volume

The scatter plot shows log(total_volume) on the vertical axis versus log(average_price) on the horizontal axis. The relationship is clearly negative and roughly linear through most of the cloud, which supports the log-log functional form, although a cluster of low-volume, high-price points in the lower right pulls away from the main band. The slope of the best-fit line through these points IS the elasticity coefficient. The points in this chart share one colour, so it does not separate conventional from organic; the type gap in the previous chart comes from the separate regressions, not from this scatter.
Why does this matter? The log-log scatter is a visual diagnostic for the model assumption: constant elasticity. If the relationship were curved or showed different slopes at different price levels, a single elasticity coefficient would be misleading, elasticity would vary with price. The linear pattern in log-log space means a 1% price change has the same percentage impact on volume whether you start at $0.80 or $1.80 per avocado. This constant-elasticity demand curve is exactly what the log-log regression models. The scatter is only a rough check, and the low-volume, high-price cluster is a reason to look at the residuals as well.
The scatter also shows meaningful dispersion around the trend line. That dispersion tells you how much volume varies at a given price; it does not tell you whether price changes caused the volume changes. This is observational data, so the slope is an association. Endogeneity is still possible: high-demand weeks can push prices and volume up together (supply constraints), which biases the estimated price effect, and no amount of scatter around the line rules that out. Treat the coefficient as a description of how price and volume moved together, and use a randomized price test or another identification strategy before reading it as the causal demand response to your own price changes.
Look closely at the spread. Observations with the same log(price) show variation in log(volume). That's regional and temporal heterogeneity. Some regions sell more volume at the same price because of different market sizes or avocado consumption cultures. Some weeks sell more because of seasonality (Super Bowl guacamole demand spikes in early February). The regression controls for region and year fixed effects to partial out these factors and isolate the price effect. The scatter shows the raw data; the regression coefficient shows the price effect after controlling for confounders.
Weekly Volume Trend (2015 to 2018)

The line chart tracks total weekly avocado volume by product type from 2015 to 2018. Conventional volume swings between roughly 55 million and 165 million units a week, with tall spikes in early February (Super Bowl week) and smaller peaks around May. There is no steady climb: the February peaks rise from about 118 million in 2015 to about 165 million in 2018, but the troughs in between stay near 55 to 65 million. The organic line is drawn on the same axis, so it sits near zero, and in this chart it stops in early 2016, so the chart cannot be used to judge organic volume. The seasonal spikes have direct implications for when to adjust prices.
Here's why seasonality matters for elasticity analysis: demand curves shift. The elasticity coefficient of −1.002 represents the average slope of the demand curve across all weeks. But during high-demand weeks, the entire curve shifts right: consumers are willing to buy more at every price. This is when you may have temporary pricing power, if shoppers planning guacamole for a party are less price-sensitive. The report does not estimate elasticity by week, so that is a hypothesis to test. In the model, a price rise adds revenue only where |elasticity| is below 1: at −0.721 (the least sensitive region on the regional chart) a 10% rise lifts revenue 2.7%, and at −1.493 it lowers revenue 4.6%.
The regression model controls for year fixed effects, which captures the upward trend. But it doesn't include week-of-year fixed effects (though you could add them). That means the elasticity coefficient pools across high and low demand weeks. If you're using this analysis to set pricing strategy, consider a more granular model: run separate regressions for high-demand weeks versus baseline weeks, or include week-of-year dummies and interact them with log(price) to estimate time-varying elasticity. You may find you can safely raise prices 5-10% during Super Bowl week without the volume drop the average elasticity predicts.
The chart is also a rough sanity check on the data: volume moves in a seasonal pattern without sudden unexplained jumps, apart from the February spikes. If we saw chaotic volatility or structural breaks, we'd question data quality or suspect external shocks (e.g., avocado shortages, trade disruptions) that violate the stable demand curve assumption. Seasonal variation driven by consumer behavior, not data artifacts, is what you want for elasticity analysis.
What the Research Question Actually Is
Before you run price elasticity analysis, you need a clear hypothesis. The research question is not "what happens to sales if we change prices?". That's too vague. The testable hypothesis is: "What is the percentage change in quantity demanded for a 1% change in price, controlling for product type, region, and time?" The log-log regression coefficient directly answers this question with a confidence interval. If the confidence interval excludes −1, you can reject the null hypothesis of unit elasticity and conclude demand is either elastic or inelastic. The sample report's interval [−1.028, −0.975] includes −1, so for avocados overall unit elasticity cannot be rejected.
Here's what you're NOT testing: whether your specific price change will increase revenue or profit. Elasticity tells you the demand curve slope, but profit maximization also depends on your cost structure, competitive response, and strategic goals. With a constant elasticity near −1, revenue barely changes with price, and the model has no interior profit-maximizing price when |elasticity| is 1 or below, so you need margin data and a demand curve that allows curvature. Elasticity is an input to pricing strategy, not the strategy itself.
What's your sample size? For detecting an elasticity difference of 0.5 units between two segments (e.g., organic vs conventional) with 80% power and alpha = 0.05, you need roughly 200 observations per segment assuming typical variance in log(price) and log(volume). The avocado dataset has thousands per segment, so it's overpowered. We can detect even small differences. If you're running this analysis on your own store data with 100 weekly observations, you can reliably estimate overall elasticity but may lack power to detect regional or product-type differences. Plan your sample size before you run the regression.
When Observational Data Works (and When It Doesn't)
Correlation is interesting. Causation requires an experiment. Except when it doesn't. Price elasticity analysis on observational data can approach a causal estimate only if price variation is exogenous to demand and you control for confounders, and that cannot be proven from the data alone. In the avocado data, prices differ across regions and weeks, and some of that difference plausibly comes from supply-side factors (growing conditions, transportation costs, wholesale market dynamics). That is an argument for exogenous variation, not a demonstration of it: high-demand weeks can also raise prices, so the coefficient here is best read as an association, and the causal reading needs a randomized test or another identification strategy.
The log-log regression controls for region fixed effects (every region has a baseline demand level), year fixed effects (national trend), and product type. This setup asks: within a region-year-type combination, when price is 1% higher, is volume X% lower? If the only reason price varies within these cells is supply shocks (exogenous to local demand), the coefficient is causal. If price varies because retailers raise prices when they anticipate high demand (endogenous), the coefficient is biased. You'd underestimate elasticity because high prices coincide with high demand weeks.
Did you randomize? For your own pricing decisions, a randomized price test is stronger. Randomly assign stores or weeks to high versus low prices and measure volume. Randomization guarantees price changes are exogenous, not correlated with unobserved demand shocks. For A/B tests, calculate the minimum detectable effect before you start. With 50 stores randomized 50/50 for 8 weeks, you can detect a 0.4-unit elasticity difference with 80% power. That's sufficient to distinguish elastic from inelastic demand.
But randomized pricing tests are expensive and slow. Observational elasticity analysis on your transaction history is fast and cheap. Use it to generate priors: if observational data suggests elasticity around −1, design your randomized test to detect differences from −1 (not from 0). Use observational elasticity to size your price changes: if elasticity is −1, test price changes of ±5% to ±10% (smaller changes may not generate detectable volume shifts; larger changes risk revenue loss). Observational analysis isn't perfect, but it's a valid starting point when you have rich price-volume data with natural variation.
Common Pitfalls in Price Elasticity Analysis
- Using linear regression instead of log-log: Linear models require you to calculate elasticity as (dQ/dP) × (P/Q), which varies by price level. Log-log gives you a constant elasticity directly from the coefficient.
- Ignoring product or regional heterogeneity: Aggregate elasticity masks critical differences. Always run segmented models by product type and region.
- Confusing statistical significance with practical significance: A confidence interval of [−1.028, −0.975] is statistically precise, but its two ends sit on opposite sides of −1, so it does not settle whether demand is elastic or inelastic. Practically the two ends are close: a 10% price rise changes revenue by between 0.27% lower and 0.24% higher. Focus on the economic magnitude, not p-values.
- Forgetting about costs: Elasticity tells you the demand curve, not the optimal price. You need margin data to calculate revenue-maximizing or profit-maximizing prices.
- Assuming elasticity is stable over time: Demand curves shift. Re-estimate elasticity quarterly or after major market changes (new competitors, economic shocks, product reformulations).
How to Interpret Your Results
You've run the log-log regression on your own data (a hypothetical result, not from the sample report). The coefficient on log(price) is −1.63 with a 95% confidence interval of [−1.89, −1.37]. What does this tell you? First, demand is elastic: |elasticity| > 1. In a constant-elasticity model, a 10% price increase lowers volume by 14.4%. Second, the confidence interval is wide (0.52 units). You're less certain about the true elasticity than the avocado analysis with its tight interval. This is typical for smaller datasets. Third, the interval excludes −1, so you can reject unit elasticity at the 5% level. Demand is elastic, not unitary or inelastic.
What pricing decision does this support? With constant elasticity, the profit-maximizing margin follows the Lerner rule: (price − cost) / price = −1 / elasticity. With elasticity −1.63 that is 1 / 1.63 = 61%, which means price = cost × 1.63 / (1.63 − 1) = 2.59 × cost. The rule only has a finite answer when demand is elastic (|elasticity| > 1). When |elasticity| ≤ 1, with constant elasticity and a fixed unit cost, profit keeps rising as price rises (at exactly 1 it approaches a ceiling without reaching one), so the model gives no finite optimum. The sample report's own estimate shows the problem: at −1.002 the rule gives a margin of 99.8% and a price of about 501 times cost, which is not a usable target, and the upper end of its interval, −0.975, has no finite optimum at all. If your current margin is 40% (price = 1.67 × cost), the model points to a higher price, but it extrapolates a constant-elasticity curve far from where the data sits, so treat 2.59 × cost as a direction to test, not a target. Revenue and profit move differently here: with elastic demand, revenue falls as price rises, yet profit can still rise because each remaining unit earns more margin.
The profit-maximizing price requires knowing your marginal cost. If cost is $0.60 per avocado and you're selling at $1.00 (40% margin), an elasticity of −1.63 implies that a 10% price increase to $1.10 lowers volume 14.4% (a volume ratio of 0.856) but raises margin per unit from $0.40 to $0.50. Profit per unit sold rises 25%, but you sell fewer units. Net profit change: 1.25 × 0.856 = 1.07, a 7.0% profit increase (cost held fixed, elasticity assumed constant). The increase pays across the whole interval: 4.4% at −1.89 and 9.7% at −1.37. It stops paying only when demand is more elastic than −2.34. At −2.50 the same increase changes profit by −1.5%. This is why the confidence interval matters: you need to know where the interval sits relative to that break-even point before deciding.
Here's the decision framework for this example: compute the elasticity at which the move stops paying (−2.34 for a 40% margin and a 10% price increase, from solving 1.25 × 1.10 raised to the elasticity = 1). If the most elastic end of your confidence interval is still above that value, the increase pays under the model's assumptions. If that end is below it, the interval spans the decision: run a tighter experiment to narrow the confidence interval before making a large pricing change.
Setting Up Your Own Price Elasticity Analysis
You need three data columns: price, quantity, and time. Optionally add product type, region, and any other segmentation variables. Format your data with one row per observation (e.g., one row per product-store-week combination). Calculate log(price) and log(quantity) as new columns. Run the regression: lm(log_quantity ~ log_price + product_type + region + year) in R or statsmodels.OLS(log_quantity, [log_price, product_type, region, year]) in Python. The coefficient on log_price is your elasticity estimate.
What's your sample size? Aim for at least 100 observations if you're estimating a single aggregate elasticity. For segmented analysis (elasticity by product type or region), you need 100+ observations per segment. If you have 10 products and 5 regions, that's 50 cells. You need 5,000 total observations to get 100 per cell. Weekly data for one year gives you 52 observations per product-region; you'd need at least two years to hit the sample size target. Plan accordingly.
Did you randomize the price variation? If not, you're relying on observational data. Check for confounders: do prices correlate with demand shocks (e.g., higher prices during high-demand weeks)? If yes, add time fixed effects (week-of-year dummies) to control for seasonality. Do prices correlate with stockouts or promotions? Add indicator variables. The goal is to isolate exogenous price variation: price changes that aren't caused by demand shifts you're trying to measure. The cleaner your price variation, the more credible your causal estimate.
Interpret the coefficient with confidence intervals. A point estimate of −1.002 without a confidence interval is useless for decision-making. The 95% confidence interval tells you the range of elasticities consistent with your data. If the interval is [−1.028, −0.975], you have a precise estimate, though here it still spans −1. If it's [−2.50, −1.70], you have high uncertainty and should collect more data or run a tighter experiment before making pricing decisions. Report both the point estimate and the interval; ignore anyone who claims precision you don't have.
Your turn
Bring your own data and the question you actually need answered.
MCP AnalyticsData science by email Send us your data and your question, and we will reply. ds@mcpanalytics.ai
Frequently Asked Questions
Why use log-log regression instead of linear regression for price elasticity?
The coefficient on log(price) in a log-log model IS the elasticity. It represents the percentage change in quantity for a 1% change in price, exactly the definition of price elasticity. Linear models require additional calculation steps and assume constant absolute changes rather than constant percentage responses. For demand analysis, percentage changes are the economically meaningful metric. Log-log regression directly estimates what you care about: how a 10% price increase affects volume, not how a $0.10 increase affects volume (which depends on whether baseline price is $0.50 or $5.00).
What does an elasticity of −1.002 mean in practical terms?
An elasticity of −1.002 means demand is almost exactly unit elastic: a 1% price increase is associated with a 1.002% drop in volume. In the constant-elasticity model, a 10% price increase multiplies volume by 0.909, a 9.1% drop in unit sales (the 10.0% shortcut is only a linear approximation). If you're at $1.00 per avocado and raise to $1.10, expect volume to fall from 1,000 units to roughly 909 units. Revenue stays at about $1,000, essentially unchanged, and at the ends of the 95% interval it moves between 0.27% lower and 0.24% higher. So the price rise mostly trades volume for margin: whether it pays depends on your costs, and with elasticity this close to 1 the data cannot say whether revenue goes up or down. These are associations in observational data.
Why is organic avocado demand more elastic than conventional?
Organic buyers plausibly have a closer substitute available: conventional avocados. When organic prices rise, price-sensitive shoppers can switch to conventional. They get the same fruit at lower cost, sacrificing only the organic certification. Conventional buyers face fewer alternatives in the same product category. Their choice is pay the higher price or switch to a different food entirely (other fruits, other fats, skip guacamole). Switching categories has higher friction than switching within the avocado category. That asymmetry in substitution options is one plausible reason for the elasticity gap: −1.752 for organic versus −0.944 for conventional. The sample report estimates the gap; it does not test the substitution explanation.
How large a sample do I need for reliable price elasticity estimates?
You need sufficient variation in both price and volume. The avocado dataset has 18,249 observations across 54 regions and 4 years (the sample report's model was fitted on 10,000 observations), providing rich cross-sectional and time-series variation. For a single store, aim for at least 50-100 weeks of data with meaningful price variation (natural or experimental) to detect elasticities in the −1 to −3 range with reasonable precision. If you're estimating segmented elasticity (by product type or region), multiply by the number of segments: 10 products × 100 observations = 1,000 total observations needed. Weekly data for two years gives you 104 observations; if you have 5 products, that's 520 total observations: sufficient for segment-level estimates but not for fine-grained product-region interactions.
Can I use price elasticity analysis on observational data or do I need a controlled experiment?
You can use observational data if you have enough natural price variation and control for confounders (seasonality, region, product type). The avocado dataset has useful price variation across regions and time, plausibly driven in part by supply-side factors (weather, transportation costs, wholesale markets), but that variation is not randomized, so the estimate is an association and unobserved demand shifts could still bias it. For causal claims about YOUR pricing decisions, a randomized price test is stronger. It guarantees exogenous variation. But randomized tests are expensive and slow. Use observational elasticity estimates as priors to design better experiments: if observational data suggests elasticity around −1, test price changes of ±5% to ±10% in your randomized test. Observational analysis isn't perfect, but it's a valid starting point when you have rich transaction data.
Related Topics in Pricing Analytics
Price elasticity is one piece of the pricing strategy puzzle. Once you know your demand curve slope, you need to combine it with cost data to calculate profit-maximizing prices. You also need to consider competitive response: if you raise prices and competitors don't, your elasticity may be higher than the historical estimate because customers can now switch to cheaper alternatives. Dynamic pricing extends elasticity analysis to time-varying contexts: how does elasticity change during peak versus off-peak periods? Conjoint analysis complements elasticity by measuring willingness to pay for product features, not just overall price sensitivity.
For products with network effects or switching costs, elasticity may not be constant. Early in the product lifecycle, elasticity may be low (few substitutes, low awareness) but rise as competitors enter. After customers lock in (subscription, platform lock-in), elasticity may fall again. Elasticity analysis assumes a stable demand curve; if your market structure is changing, re-estimate quarterly to track shifts. Cohort-based elasticity analysis (elasticity by customer tenure or acquisition channel) can reveal these dynamics.
Before we draw conclusions about optimal pricing, let's check one more thing: did you validate the model assumptions? Log-log regression assumes constant elasticity (linear relationship in log-log space), no omitted variables correlated with price and volume, and homoskedastic errors. Plot residuals versus fitted values to check for heteroskedasticity. Plot log(volume) versus log(price) to visually confirm linearity. Run robustness checks: does elasticity change if you add week-of-year fixed effects? Does it change if you drop the top and bottom 5% of price observations (outliers)? If the coefficient is stable across specifications, you can trust it. If it jumps around, you have model uncertainty: report the range and design experiments to resolve it.