
Where is the biggest leak in your funnel?
That question has two correct answers. They point at different steps, and they fund different work.
What is funnel analysis?
Funnel analysis measures where people stop in an ordered sequence of steps. Signup, checkout, onboarding, a job application, a support escalation: anything where reaching step three means you already got through steps one and two. It is sometimes called conversion analysis or drop-off analysis, and in older marketing writing a purchase funnel, after the shape it draws.
The idea is old and the arithmetic is simple. What makes it worth doing carefully is that the obvious summary of a funnel is ambiguous, and the ambiguity is invisible: the phrase "the biggest leak" describes two different measurements that usually disagree about which step to fix.
It answers questions a single conversion rate cannot:
- Which step loses the most people, in absolute numbers?
- Which step converts worst, as a share of the people who reached it?
- Does either answer change once you split by channel, plan or device?
One thing it deliberately does not handle: people who are still mid-journey. Someone who signed up yesterday has not failed to convert, they simply have not got there yet, and a funnel counts them as a drop-off. If the timing matters more than the sequence, the tool you want is survival analysis, which is built for exactly that.
The ambiguity in "the biggest leak"
Somebody puts a funnel chart on a slide, points at the widest gap, and a sprint gets funded. The problem is that "biggest" was never defined, and the two available definitions disagree.
The volume answer is which step loses the most accounts. The efficiency answer is which step converts worst, as a proportion of the people who actually reached it. Both are correct. Both are useful. They are usually different steps, and only one of them is the step whose behaviour is genuinely unusual.
Both answers, on a worked dataset
Everything below runs on one constructed dataset: a quarter of self-serve signups at a hypothetical B2B software company, with the counts set by hand and the dates drawn from a fixed seed. 2,500 accounts arrive at a plans page, and 180 end up paying. Five steps, one row per account per step reached.
| Step | Reached | Lost here | Step conversion | 95% CI |
|---|---|---|---|---|
| visited_pricing | 2,500 | n/a | n/a | n/a |
| → started_trial | 1,050 | 1,450 | 42.0000% | 40.06 to 43.97 |
| → activated | 680 | 370 | 64.7619% | 61.78 to 67.64 |
| → invited_teammate | 245 | 435 | 36.0294% | 32.44 to 39.78 |
| → converted_paid | 180 | 65 | 73.4694% | 67.40 to 78.79 |
End to end, 7.2% of visitors pay. The volume answer is the first step: 1,450 accounts never start free, more than any other gap loses. The efficiency answer is three steps further down: of the accounts that activate, only 36% ever invite a teammate.
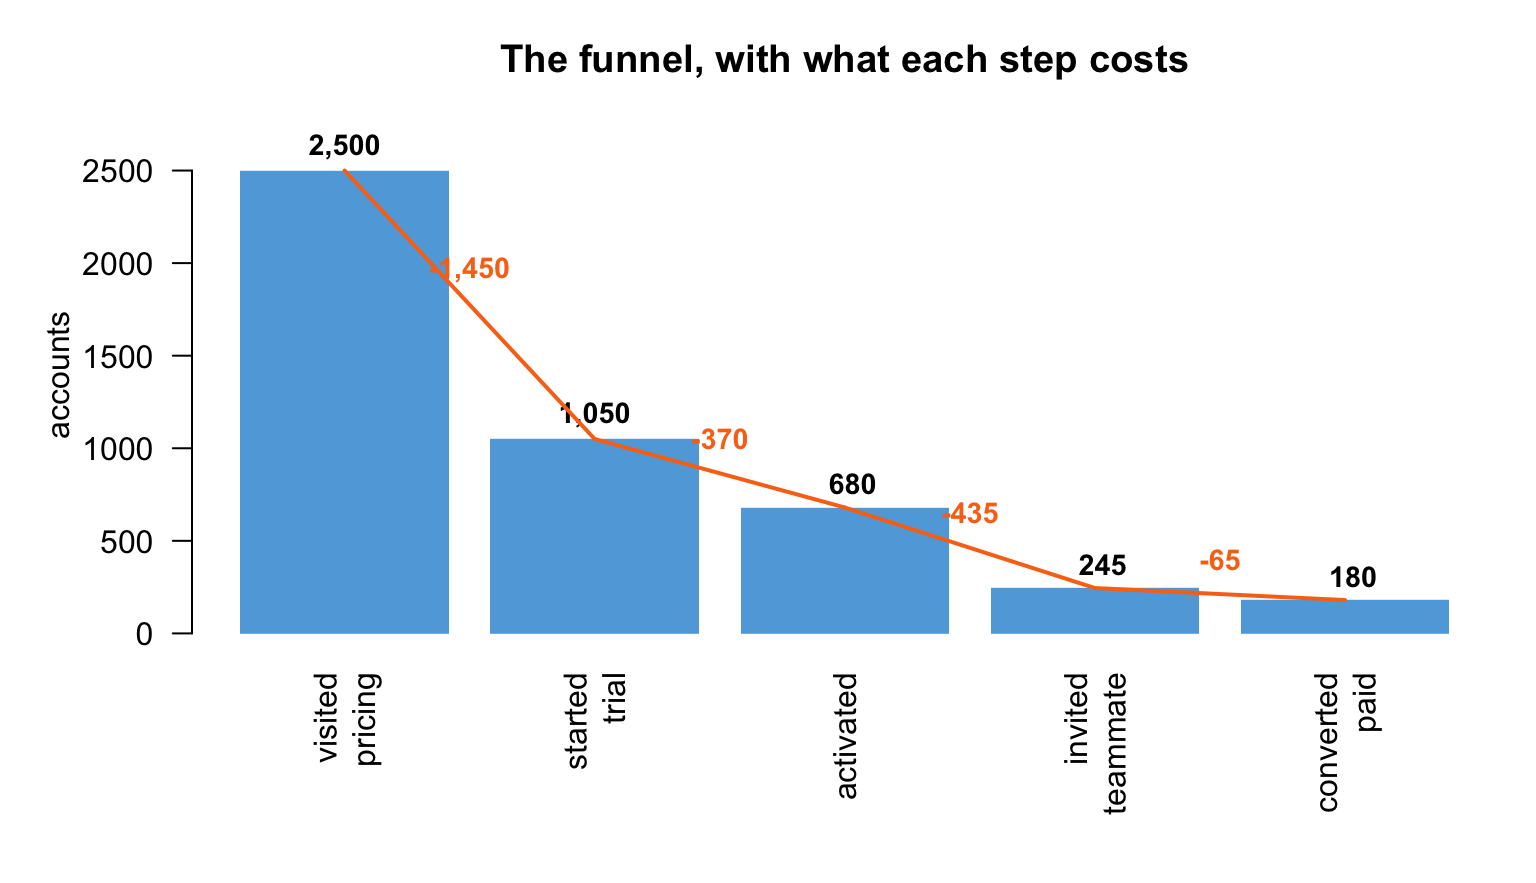
Check the uncertainty before you rank anything. The direct check is an interval for the difference between the two rates, not a comparison of their separate intervals: intervals that overlap can still hide a real difference, and intervals that do not overlap do show one. Here the separate intervals are 40.06 to 43.97 against 32.44 to 39.78, and the entry step converts 6.0 points better than the invite step (95% interval 1.8 to 10.2). On this quarter's data the ranking holds. The stages are nested, so this treats the two rates as independent, which is an approximation; the gap is wide enough that it does not change the reading. That check takes a second and it is the one most funnel charts skip.
Why the first step almost always wins the volume answer
Worth naming, because it stops the volume answer being over-read: the first gap draws from the largest pool. A step that loses a modest share of 2,500 people will lose more humans than a step that loses a terrible share of 680. So "loses the most" is partly a fact about arithmetic and position, not only about how bad the step is. The efficiency answer is what tells you a step is behaving unusually.
The finding the aggregate was hiding
A rate for the whole funnel is a summary of groups that may behave nothing alike. Split these accounts by acquisition channel and one of them does something the aggregate cannot show.
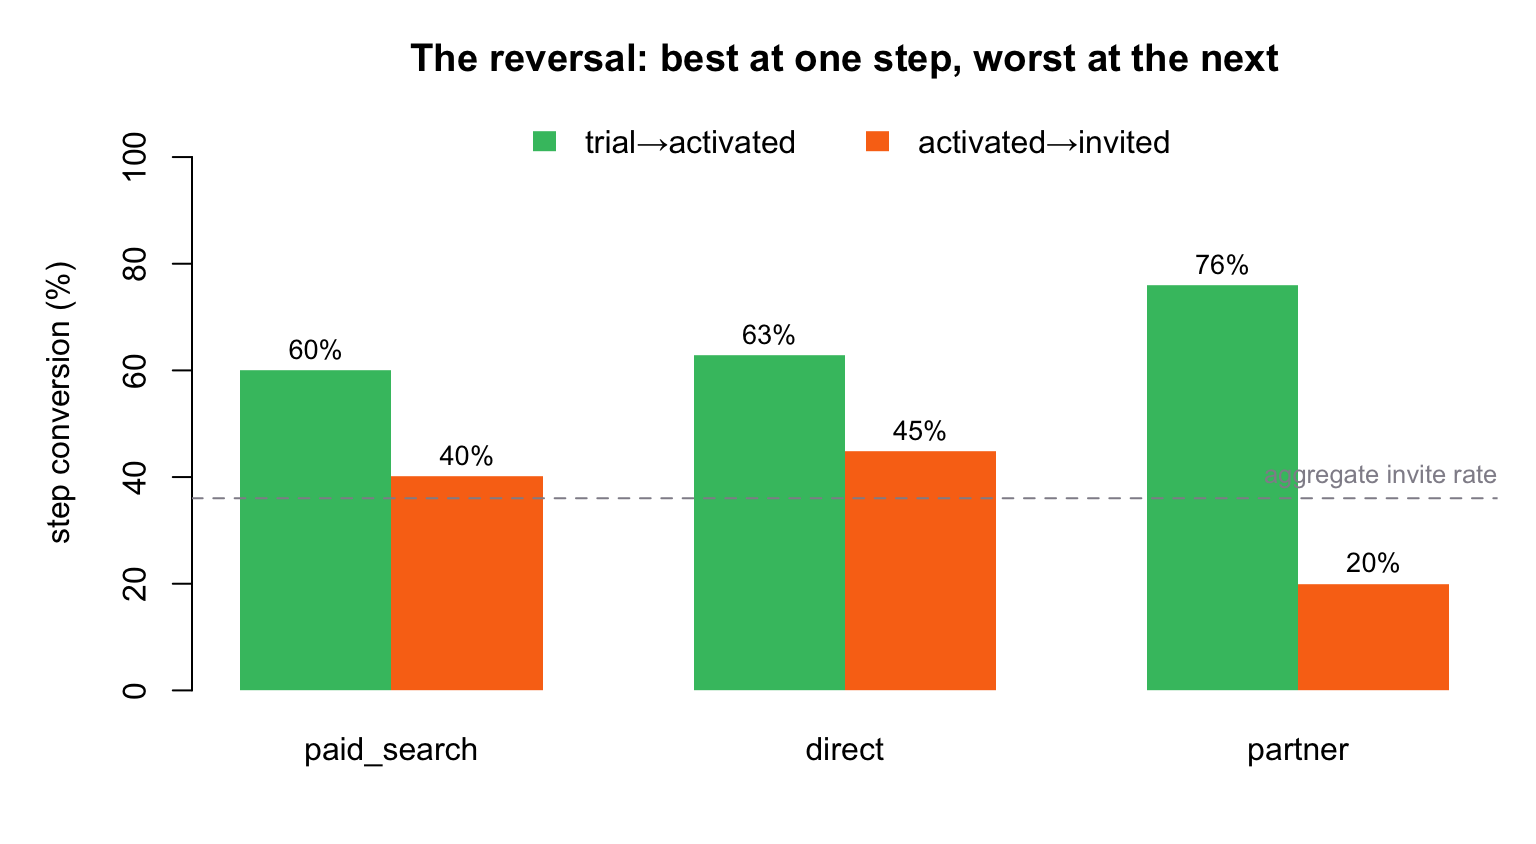
Partner accounts activate at 76% against paid search's 60%, a gap of nearly 16 points. If the two channels truly activated at the same rate, a gap that large would turn up about three times in a hundred thousand. Then at the next step they invite a teammate at 20% against paid search's 40%, a reversal of 20 points that would turn up about eight times in a million under no true difference. (These accounts are a constructed dataset, so the tests show how the check is run, not a discovery about real customers.)
The aggregate 36% invite rate is an average over a channel running at 20% and one running at 40%. It describes neither. It does not make partner the whole problem: paid search loses more accounts at the invite step (164 against partner's 152, with 119 for direct). It makes partner the most lopsided part of it, and the strongest candidate to investigate first. The counts cannot say why partner accounts do not invite a teammate, or what a fix would cost against the roughly 38 extra invites a quarter it could recover (partner at paid search's invite rate). Those are the questions to answer before funding a sprint.
What the analysis needs from your file
One row per account per step reached. Three columns, plus one optional column that unlocks the most useful part.
| account_id | stage | event_at | channel |
|---|---|---|---|
| acct_dir_0001 | visited_pricing | 2026-04-24 | direct |
| acct_dir_0001 | started_trial | 2026-04-26 | direct |
| acct_dir_0001 | activated | 2026-04-30 | direct |
Real rows from the file below. One account appears once per step it reached, and simply stops appearing at the step it did not reach. That is how the analysis knows where it fell out; there is no "did not convert" row to add.
- An account or session id, so steps can be linked into a journey.
- A stage label, and the steps have to be genuinely ordered. Optional or parallel stages produce a funnel whose narrowing is an artifact of the order you chose.
- A timestamp for when that step was reached.
- Something to break it down by, and this is the one worth adding: channel, plan, device. Without it you cannot find a reversal like the one above.
The breakdown column has to be a label, not a measurement. If you want the funnel by company size, sort the sizes into a few named bands first. A column of raw numbers becomes one group per account, every group is too small to report, and the analysis will tell you there is not enough data when the real problem is the column's shape.
And per-step totals are not enough for the most useful part. If all you have is 2,500 then 1,050 then 680, you can still work out the losses, the step rates and an interval for each, and so tell the volume answer from the efficiency answer. What you cannot do is segment: you cannot find a reversal like the channel one, because totals cannot be turned back into rows.
Every number here, you can re-run
This page is not a screenshot of an analysis. It is an analysis. The document derives every figure when it runs, and it was checked three ways: by the document itself, by R's two-proportion test called directly on each step, and by an independent Python reimplementation. All three agree to every digit shown.
Read the full knitted analysis, the document itself with every chart, table and line of code as it ran. Or take the source and the data below and run it yourself.
The limits, stated plainly
Three things this analysis cannot tell you, and none of them announces itself in the output.
It cannot see people who are still mid-journey. An account that started last week and has not activated yet is counted as a drop-off. Over a short window, or a period where signups grew, that alone can move every rate downward. Funnel analysis has no concept of an unfinished journey; survival analysis does.
It cannot tell you why. The reversal above is a real, measured difference. Whether partner accounts stay single-seat because of who they are, how they were sold, or what the product does after activation is not in this data.
It will draw whatever order you map. The narrowing shape is produced by the sequence you declare, so a mis-declared sequence produces a confident and meaningless funnel.
Download
Two files. The notebook regenerates the dataset from its seed, so re-knitting reproduces this page's figures exactly.
- funnel.Rmd · the analysis, R Markdown source10 KB
- funnel_events.csv · 4,655 events across 2,500 accounts251 KB
Both files are released under CC BY 4.0: use them anywhere, including commercially, with attribution.
Why this matters to the business
three 60-second cuts · scroll for more →
The brief for an AI agent
If an AI assistant is choosing a method for you, it needs different things than you do: the discriminating condition, the questions this gets mistaken for, the failure modes that return a plausible number instead of an error, and figures it can cite rather than generate. We publish that as its own document, written to one bar: an agent asked whether to run this analysis should be able to answer from it alone, including saying no.
Read the agent briefRun this on your own funnel
Upload an event log with an account id, a stage, a timestamp and a channel, and get the step counts, the losses, the conversion rates with confidence intervals and the per-channel breakdown back. Free, and no account needed.
your file is deleted after seven days · PDF and citation includedYour turn
Bring your own data and the question you actually need answered.
MCP AnalyticsData science by email Send us your data and your question, and we will reply. ds@mcpanalytics.ai