Real analyses on real data. Each one was generated by the MCP Analytics team — interactive in the browser, exportable as PDF, citable, and reproducible. Click any card to open the full live report.
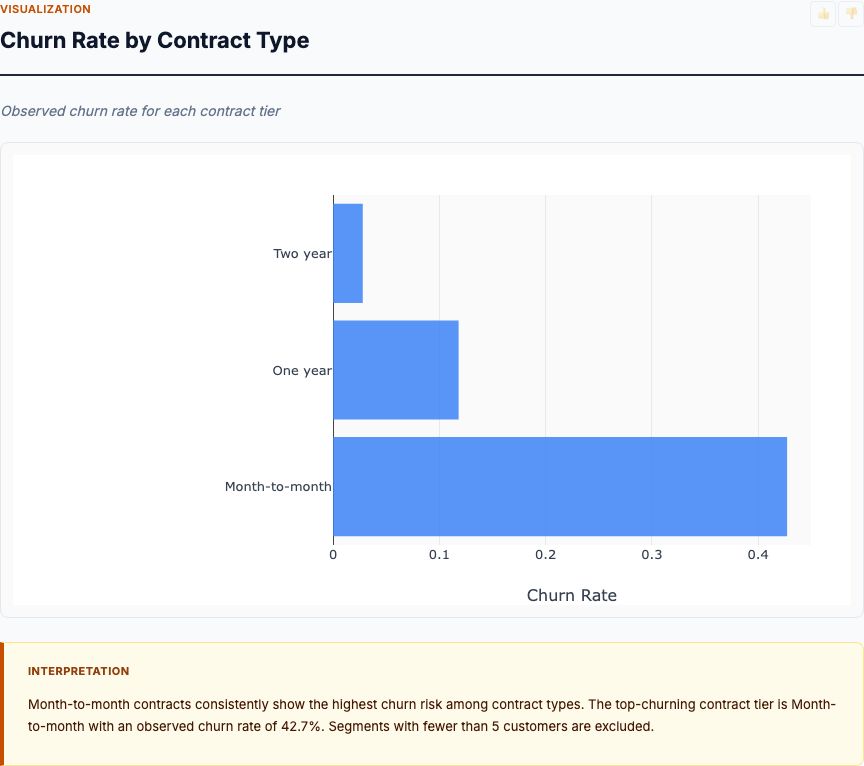
Logistic regression with feature importance, ranking the behavioral and demographic factors that predict whether a customer will churn.
View report →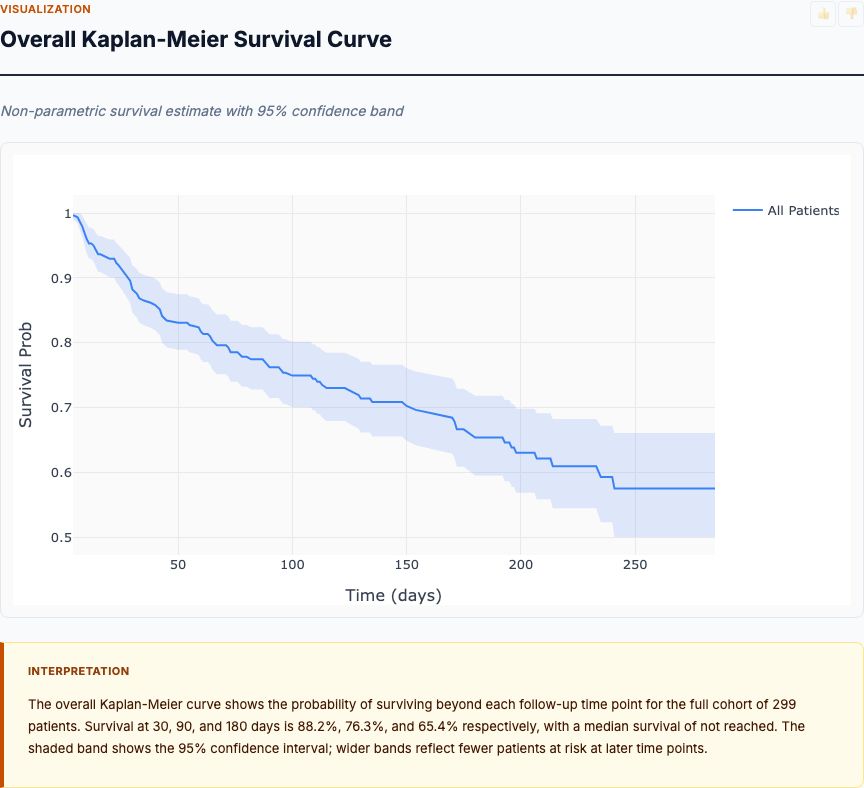
Cox proportional-hazards survival analysis with Kaplan–Meier curves, quantifying time-to-event risk across patient cohorts.
View report →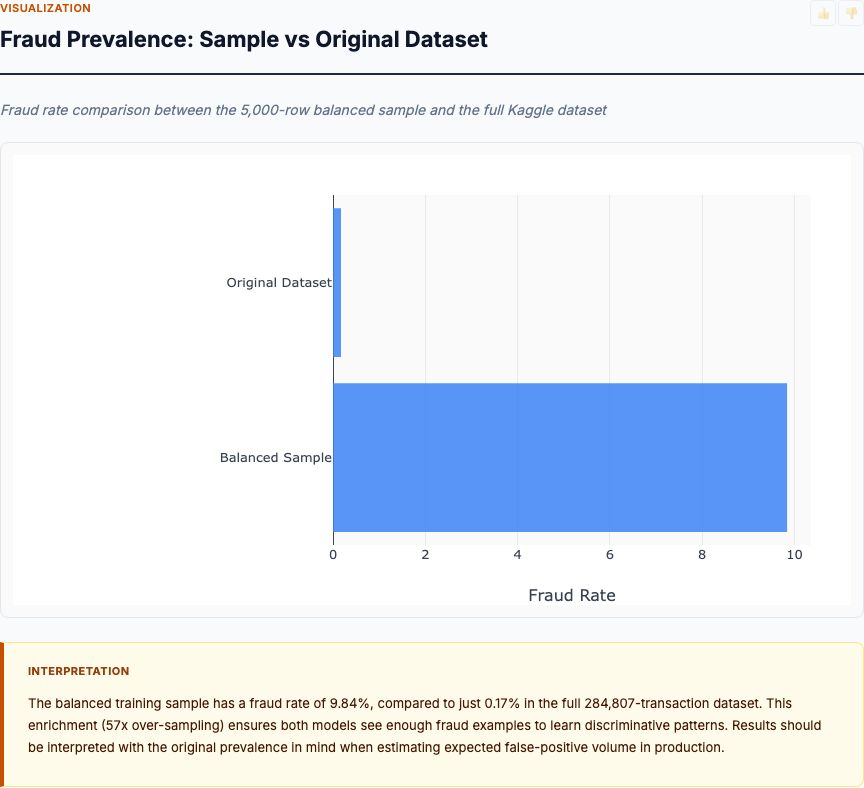
Isolation forest anomaly scoring on transaction features, surfacing the highest-risk outliers with explanation by feature contribution.
View report →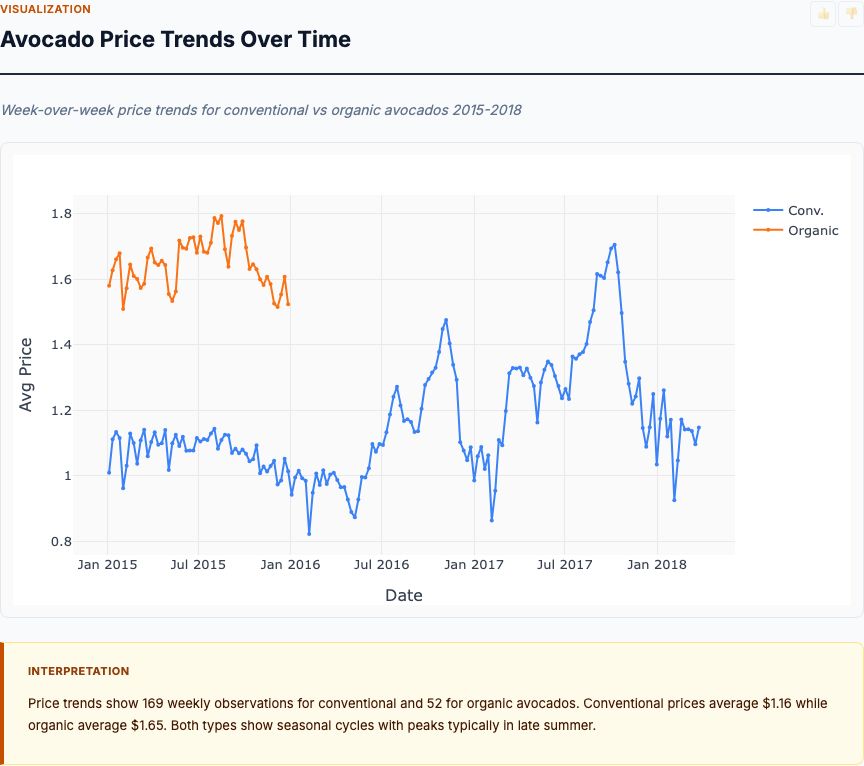
ARIMA time-series forecast with seasonal decomposition and confidence intervals, projecting weekly sales over the planning horizon.
View report →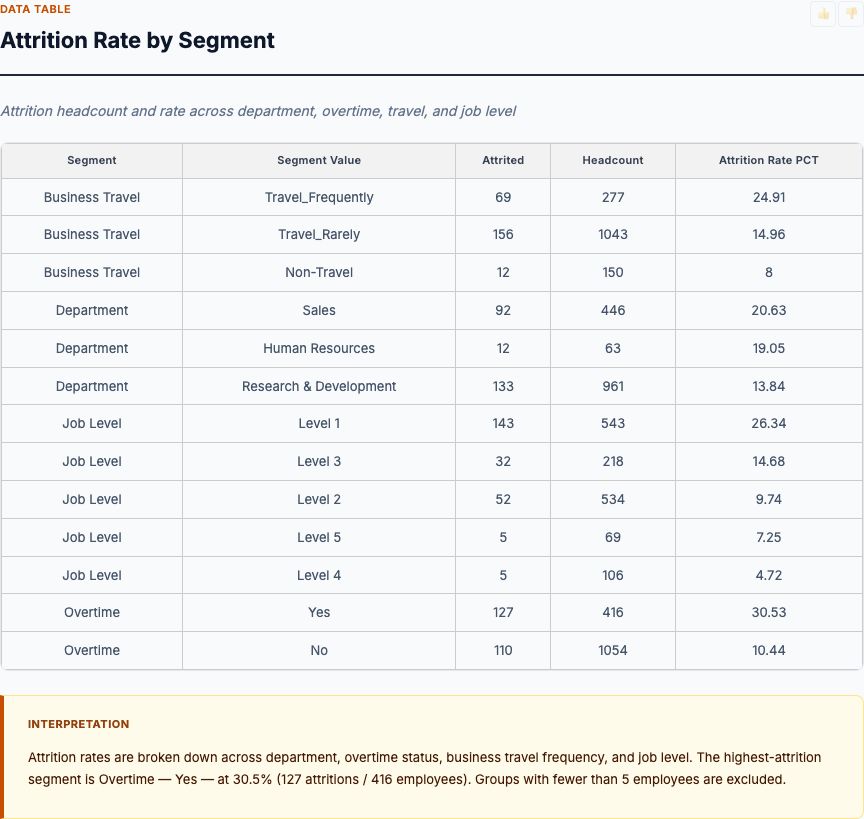
Logistic regression on attrition drivers — tenure, role, compensation, satisfaction — with odds ratios and a ranked driver list for retention planning.
View report →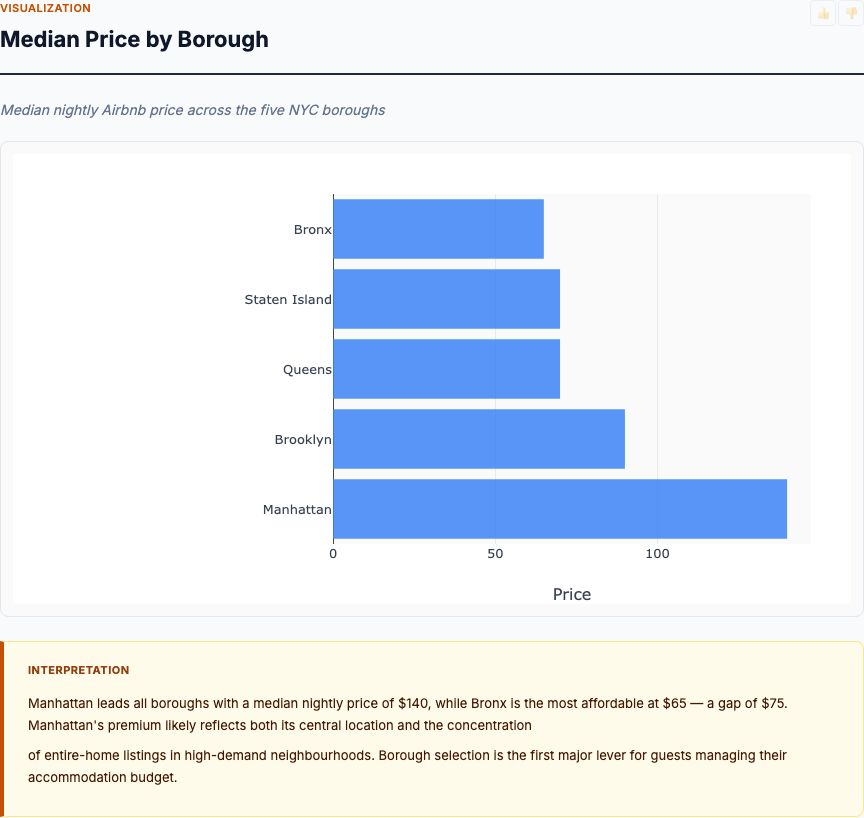
Geographic regression on listing-level features with location effects, identifying which property attributes move price most in each market.
View report →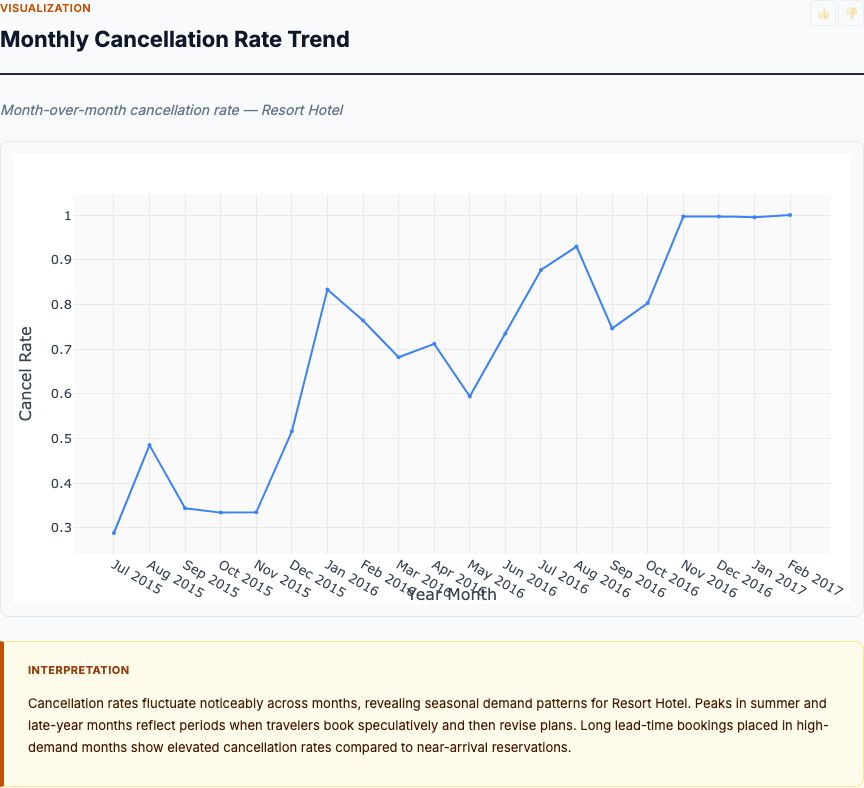
Classification model predicting booking cancellation probability, with calibration plots and a ranked feature-importance breakdown.
View report →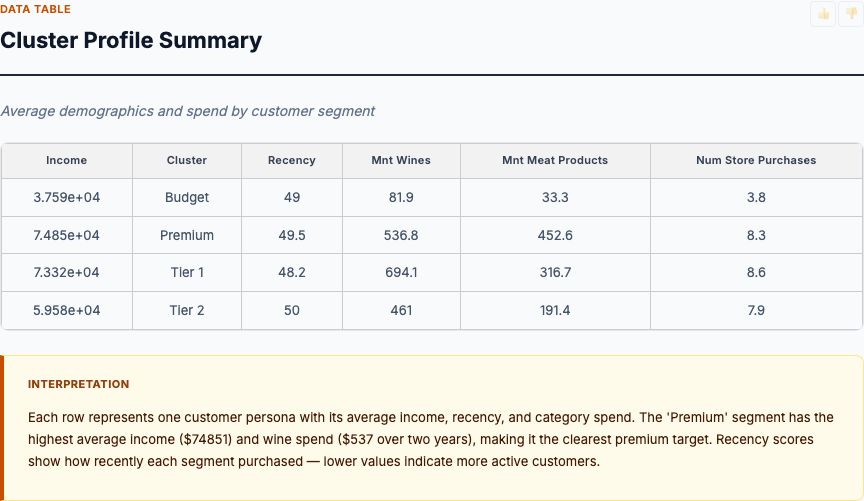
K-means clustering on behavioral features with silhouette validation, producing interpretable segment profiles for targeting and lifecycle marketing.
View report →Every analysis includes the same components designed for real-world decision making.
Zoom, pan, and hover over charts. Residual plots, Q-Q plots, feature importance, time-series decompositions, and correlation matrices.
R², RMSE, MAE, p-values, confidence intervals, AIC/BIC — every relevant statistic for the analysis type. Nothing hidden.
Plain-English interpretation that explains what the numbers mean. Key findings, recommendations, and actionable next steps.
APA, MLA, Chicago, BibTeX in one click — paste straight into a paper, deck, or compliance filing. Methodology and source travel with the citation.
Validated R source code is embedded in every report. A skeptical reader can rerun it and get the same answer.
Fixed seeds, Docker isolation, validated R. Same input → same output on any machine, any day, forever.
Upload a CSV or connect a live source. Describe what you want to know. The team builds, validates, and ships the report.